

Demand
69M
Supercharger sessions in Q3 2026, up 29% from a year earlier.
Source: Tesla Charging Q3 2026 scorecard, via EVwireTesting the watersNo money is being solicited or accepted. An indication of interest involves no obligation. Read the notice
How it works
From your first $100 to monthly dividends, and every kilowatt-hour in between.
Create your Carbon account in minutes and choose how you'd like to hold your share.
One investment will buy units of the fund, which owns every site in its portfolio. Today you can reserve your spot; no money is collected.
Your $25K is spread across all 40 sites, about $625 in each.
Illustrative only. Based on a hypothetical $25,000 investment. Amounts are not projections and are not guaranteed.
We sign long-term agreements with property owners, secure Tesla approval and utility power, then permit and build each site until it's energized.
Typical (median) figures across Carbon's site research.
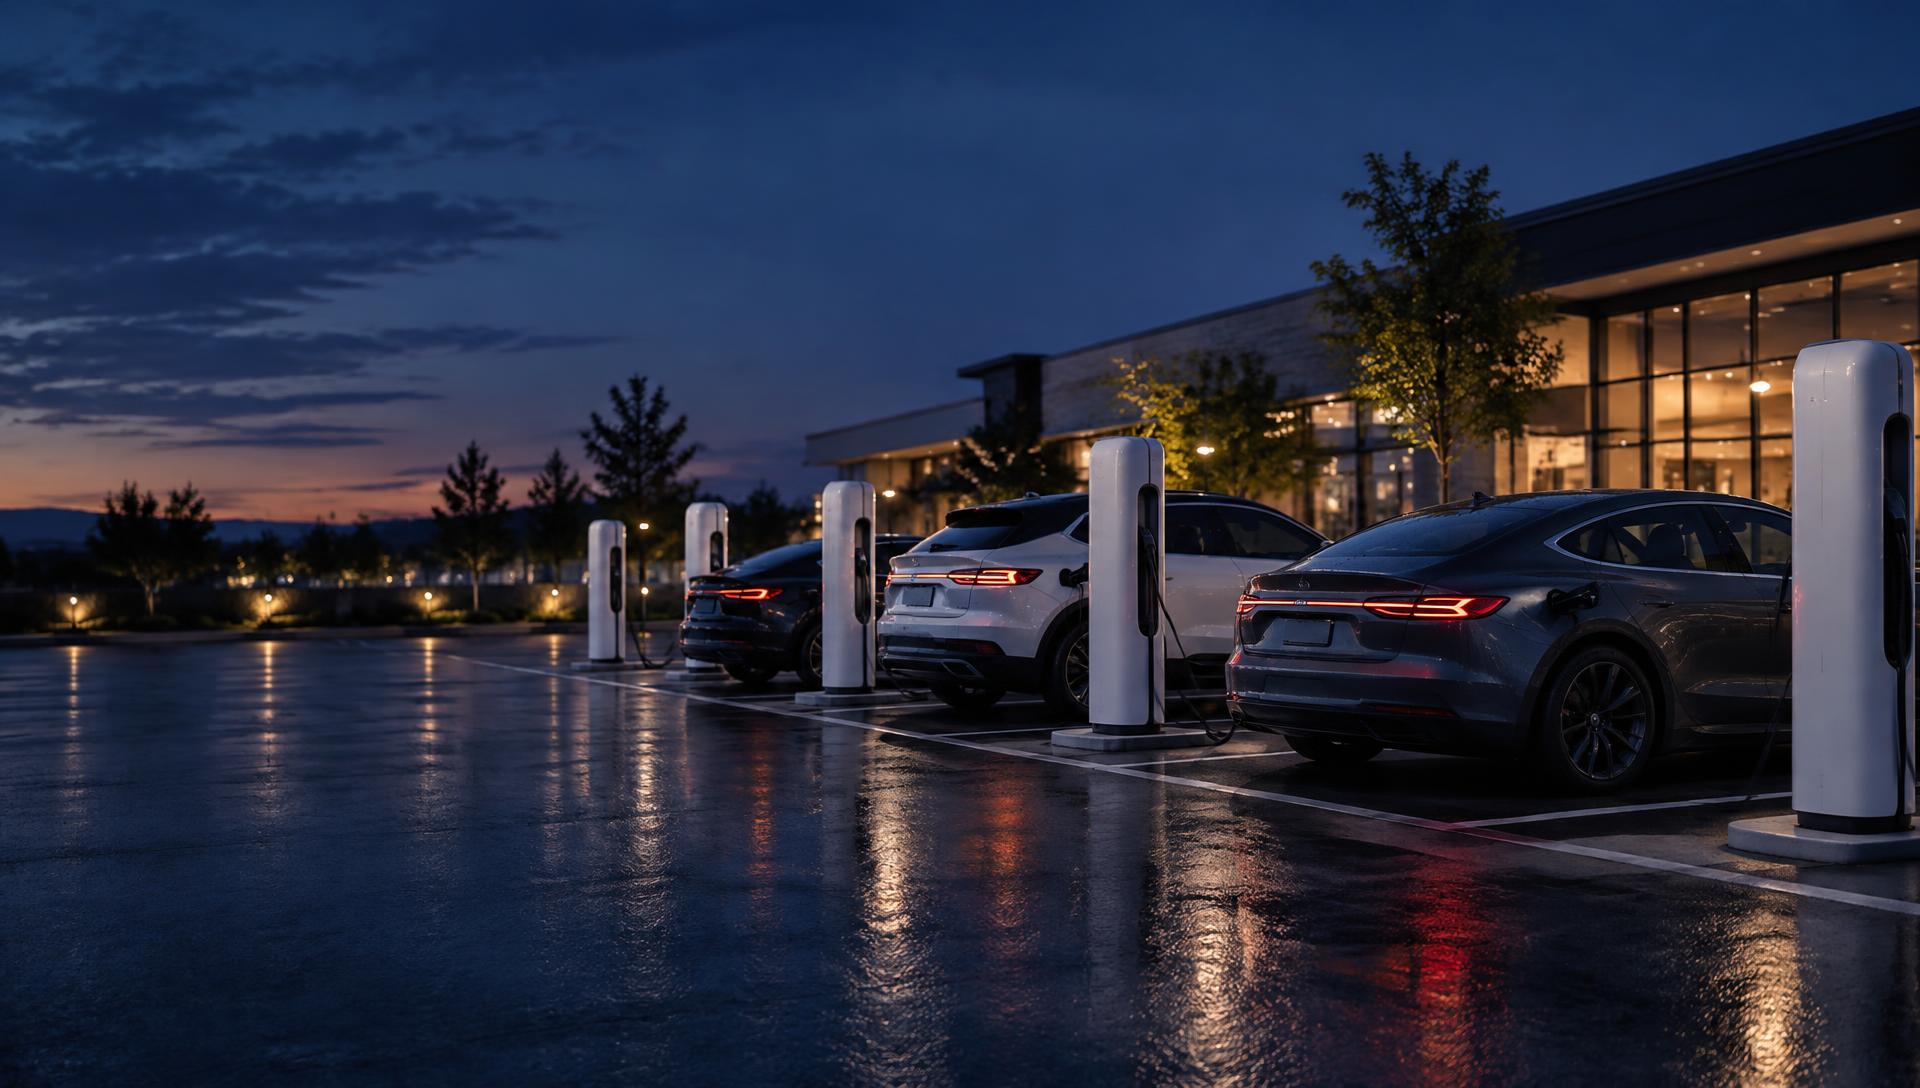
Once a site is energized, drivers plug in around the clock. A typical session delivers about 75 kW for roughly 27 minutes.
Illustrative, based on a typical Carbon site.
Drivers pay per kWh. Tesla's network handles payment, software and support, and credits the revenue to the project.
Illustrative, based on a typical Carbon site.
Electricity and demand charges, the network fee, rent, maintenance and insurance are paid first. What's left is net cash flow.
Illustrative, based on a typical Carbon site. Varies site by site with traffic, pricing and power costs.
Net cash from every energized site flows into the fund, so income is spread across many locations instead of one.
Each month the board declares a distribution, deposited to your bank or reinvested. Distributions are targeted, not guaranteed.
Based on the fund's 11–17% target net yield. Examples use the conservative 11% case: $229.17 a month.
Illustrative only. Based on a hypothetical $25,000 investment. Amounts are not projections and are not guaranteed.
Take your monthly distributions as cash, or reinvest them to buy more units and let them compound.
Reinvestment applies if and when a distribution reinvestment option is offered.
Hypothetical illustration. Assumes all distributions are reinvested at the same yield and excludes any change in unit value or exit proceeds. Not a guarantee of future results.
01 / 09 · You sign up
Pick an amount and a target yield, then take your distributions as cash or reinvest them.
$100 minimum$250,000
Target yield
Distributions
Yield ramps to stabilization: about 50% of the target in year 1, about 85% in year 2, then the full target from year 3. Reinvesting buys more units each month at the same yield.
Hypothetical illustration using the fund's target net annual distribution yield (11–17%) after fees, with a ramp to stabilization. Reinvestment assumes distributions buy additional units at the same yield if a reinvestment option is offered. Excludes changes in unit value and exit proceeds. Not a guarantee of future results.
Start from a typical charging location and see how stalls, utilization and price change a site's economics.
Starting values are the typical (median) stall count, utilization and price across Carbon's published site research.
Average delivered power is fixed at 75 kW per stall.
Sessions per day assume an average session of 0.45 hours: utilization × 24 h ÷ 0.45 h, per stall.
Net cash flow applies a typical net margin (26.6%); net capital scales at $120K per stall.
Gross = stalls × 8,760 h × 75 kW × utilization × price, the same formula as the site profiles. Return per $1 sums 10 years of net cash flow with a two-year ramp (50%, then 85%, then 100%) and divides by net capital.
Illustrative estimates, not projections of fund returns.
Sourced figures on the network, and what we measured near our own sites.
Demand
69M
Supercharger sessions in Q3 2026, up 29% from a year earlier.
Source: Tesla Charging Q3 2026 scorecard, via EVwireBusiest stalls ever
10+ a day
Sessions per stall per day passed 10 at the 2026 peak, the highest since 2019.
Source: Tesla Charging Q3 2026 scorecard, via EVwireMarket leader
~49%
of all U.S. fast-charging ports are operated by Tesla.
Source: Paren, Q3 2026, via EV Infrastructure NewsGrowing every quarter
50.4M
U.S. fast-charging sessions in Q3 2026, up 26% from a year earlier.
Source: Paren Q3 2026 report, via EVwireMeasured near our sites
20% – 59%
Observed utilization at 11 comparable stations near one of our sites. A typical Carbon site underwrites 35%.
Bars: Carbon site research. Break-even: a typical stall covers its costs and repays its net capital over 10 years (0% return). U.S. average: Paren, Q3 2026.
See the full site researchCulver City, CA
Culver Commons
Chandler, AZ
Arizona Avenue
Dallas, TX
Northpond
Projected, site-level, before fund fees. Not a guarantee of future performance.
Fees and expenses are described in the Offering Circular. Fund fees and disclosures
Be early
Non-binding. No money now. Minimum $100 when we launch.