
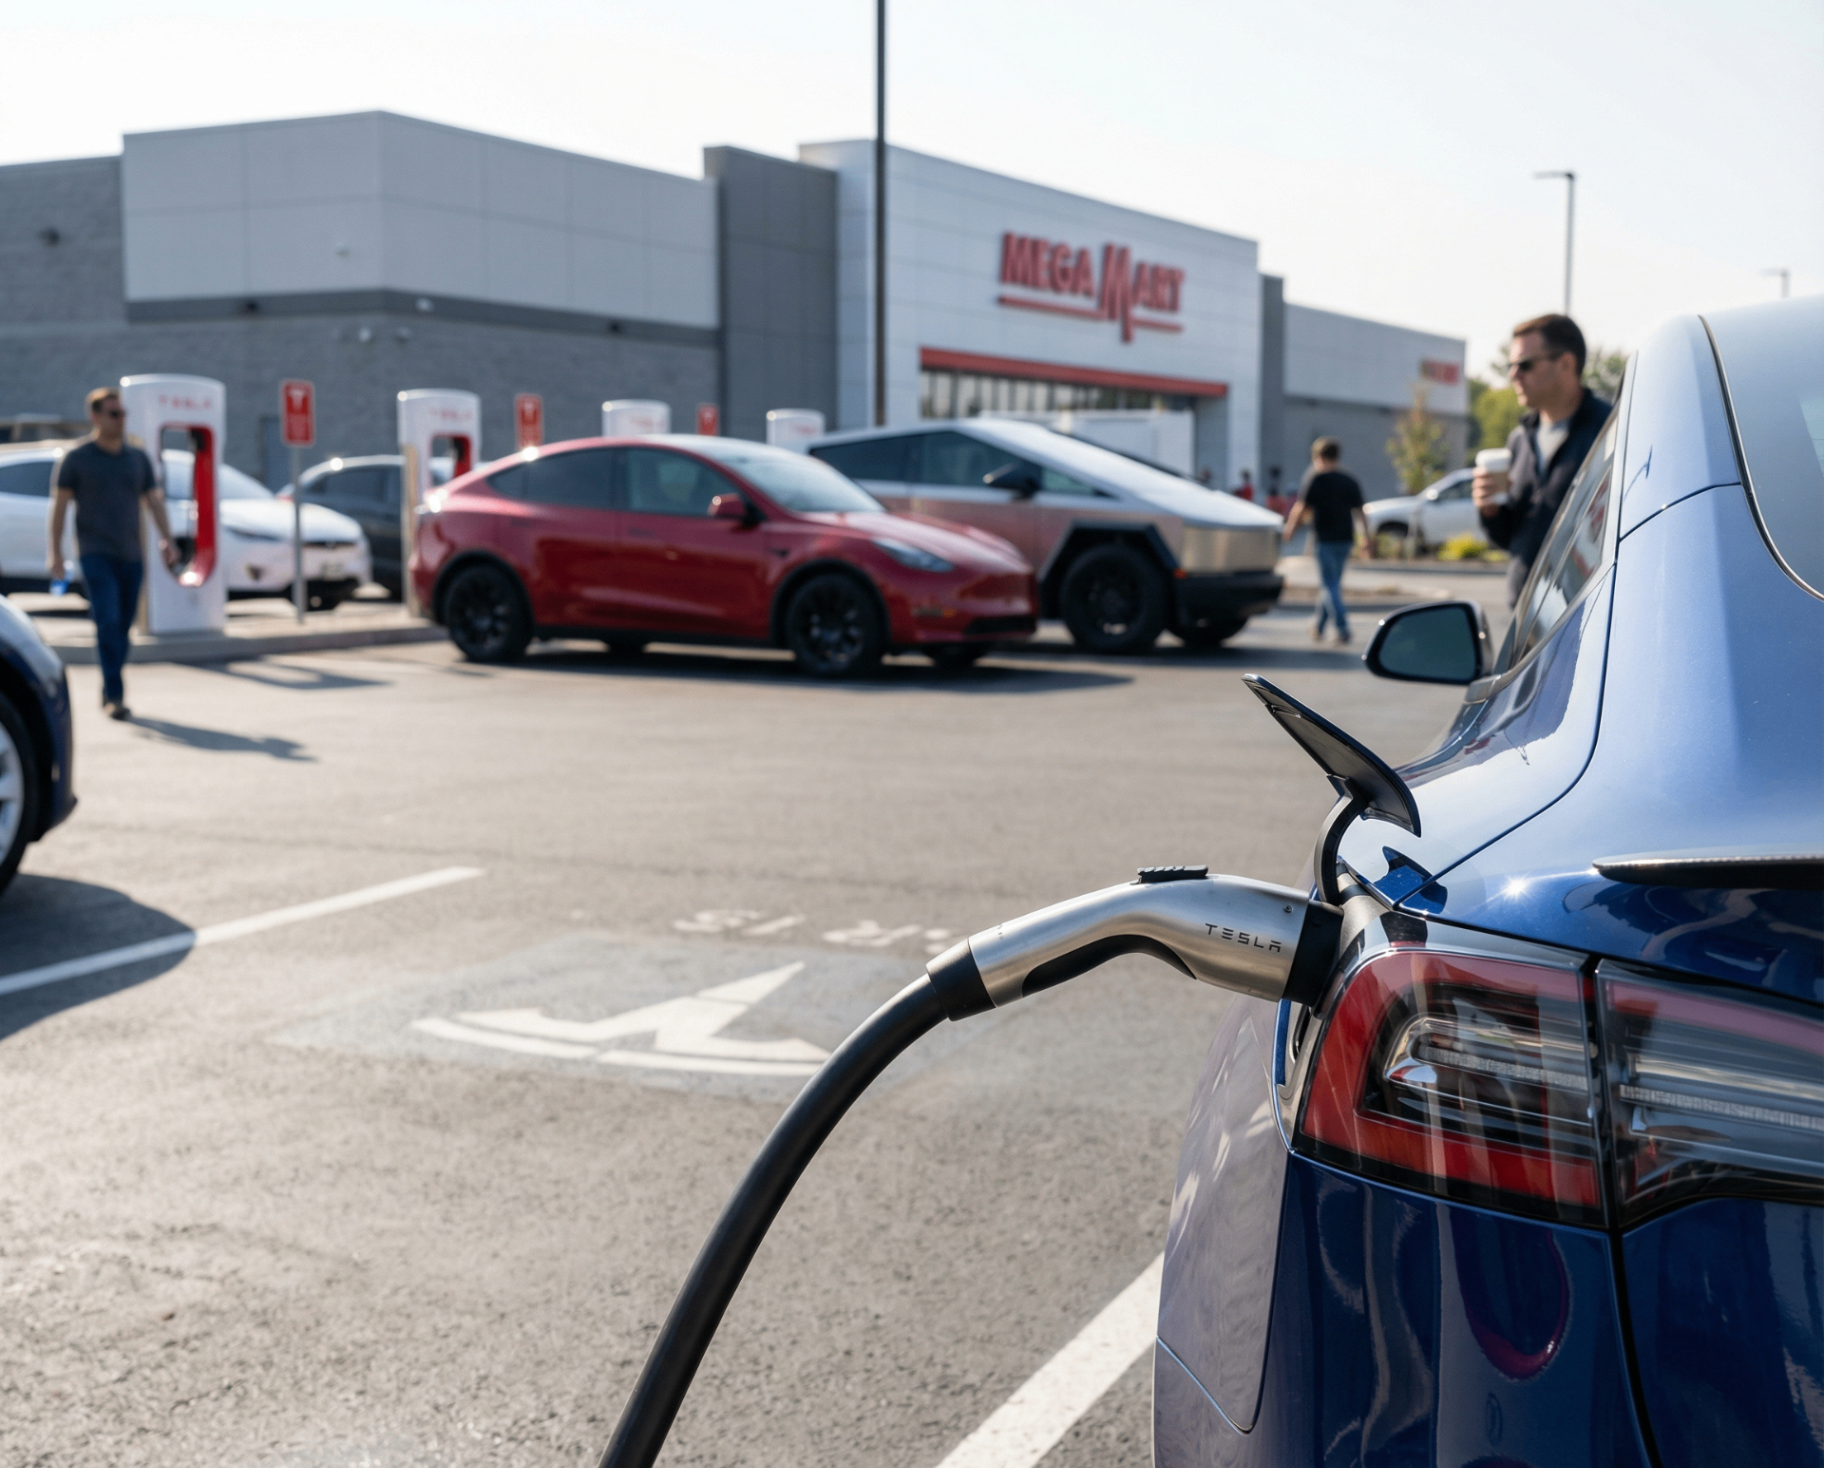
Gates of the Promenade
Jacksonville, FL
Illustrative image
- Projected IRR
- 21.9%
- Est. annual revenue
- $816K
- Stalls
- 8
Projected
Projected
Projected, site-level, before fund fees and expenses. Not a guarantee of future performance.
01 / Comparable charging stations
3 stations within 3 miles. Select a row to find it on the map.
02 / Site summary
Greenfield site with 8 Supercharger stalls at a grocery-anchored location in Jacksonville, FL.
- Property type
- Grocery-anchored
- Utility
- JEA
- Proposed stalls — V4 Supercharger
- 8
- Opportunity type
- Greenfield
- Agreement type
- Assignment of existing agreement
- Term
- 25 years
- Renewals
- -
- ◇57,000 vehicles a day on the nearest arterial
- ◇6 fast-charging sites within 3 miles averaging 30% utilization
- ◇Freeway access nearby
03 / Trade area & traffic
92,000
Daytime population$61,821
Median household income45%
Of local EVs are Teslas57,000
Daily traffic (AADT)- Median household income, trade area
- $61,821
- Freeway access
- Yes
- Fast-charging ports within 3 mi
- 20
- Fast-charging sites within 3 mi
- 6
Beach Blvd Southside commercial and suburban arterial corridor Carbon estimates; not independently verified.
04 / Charging demand
Observed utilization at comparable stations
28% – 31%
Range across 3 reported comparable stations, 29.7% blended. Carbon underwrites 27.7%.
- Underwritten utilization
- 27.7%
- Tesla Supercharger stations within 3 mi
- 1 · avg 31%
- Modeled price per kWh
- $0.56
- Local average price per kWh
- $0.51
Underwritten figures are estimates. Dots show measured comparable stations; the triangle marks Carbon’s underwritten level.
05 / Expected financial performance
Projected · Baseline scenario · site level, before fund fees
21.9%
Projected IRR$202K
Year-3 annual cash flow$816K
Est. gross charging revenue / yr4.6 years
Payback$4.91M
Lifetime cash generated over 25 years$5.88 back per $1
5.9xReturn per $1 investedProjected cumulative cash flow
Baseline Downside
Starts at minus net capital in year 0. Cash flow ramps to 50% of the stabilized level in year 1 and 85% in year 2, then stays flat; the chart's payback point reflects that ramp, while the Payback tile is Carbon's underwritten figure.
Upside drivers
- ◇Utilization growth: Carbon underwrites 27.7%; nearby comparable stations already reach 31%.
- ◇Renewals: any renewal of the agreement would extend cash flow beyond the initial term.
Est. gross charging revenue = stalls × 8,760 hours × 75 kW average delivered × 27.7% utilization × $0.56 per kWh. Shown at the underwritten utilization in both scenarios.
Lifetime cash = sum of annual cash flow over the term with a two-year ramp (year 1 at 50%, year 2 at 85%, year 3 onward at 100% of year-3 cash flow). Return per $1 = lifetime cash ÷ net capital.
Projected, site-level, before fund fees and expenses. Based on Carbon's underwriting of comparable stations; actual results will vary. Investors own units of the fund, not this site; fund-level returns differ. Not a guarantee of future performance.
This site in the fund
2.6%Share of fund stalls
Investor returns come from the whole fund, not one site. Site-level projections on this page are before fund fees and expenses; fund-level returns differ.
06 / Nearby tenants & amenities
Nearby places are available in the online edition.
07 / Readiness
- 1
Site control
Not reported
- 2
Tesla approval
Not reported
- 3
Utility capacity
Not reported
- 4
Permits
Not reported
- 5
Construction
Not reported
- 6
Energized
Not reported
Fund terms
Fund details and disclosures →- Minimum investment
- $100
- Target net yield
- 11–17% (target)
- Distributions
- Monthly (target)
Research as of 2026-11-14. Sources: Weekly utilization data, Jul–Oct 2026.
Gates of the Promenade